Step Through PeopleCode
In PeopleTools 7.5, we had Application Reviewer for debugging PeopleSoft. For PeopleTools 8.4x and 8.50, since the panels are now pages on the browser, how do we debug peoplecode (interactively)? The answer follows:
How to Step Through PeopleCode
To step through PeopleCode that is running on the browser, do the following. The first four steps will be handled by your PeopleSoft Administrator.
- Ensure the appropriate PSDBGSRV Listener Port is specified on the App Server.
- At least two PSAPPSRV processes should be configured on the App Server.
- The Service Timeout parameter should be set to zero.
- The “Enable PSDBGSRV Server Process” should be set to Yes on the App Server.
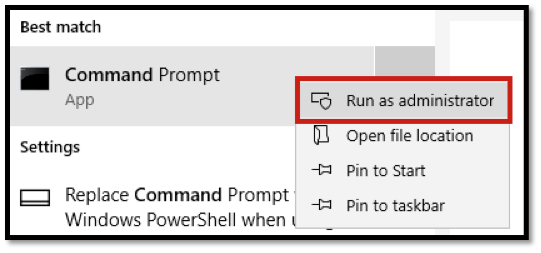
- Launch Application Designer on the workstation. Log in using 3-tier and your userid.
- Under menu item Debug, select “Enter Debug Mode”.
- Launch PeopleSoft through the browser, and use the same userid as in step 5.
- Go the page needing review.
- On the debug menu in App Designer, select either debug at start or create new breakpoints (similar to 7.5).
- Go back to the browser and trigger the PeopleCode. Once the breakpoint is triggered, the App Designer will wait for you to respond. The web browser will appear to be loading the next page (“Processing” might flash).
Special Notes
- May not work on Windows 95 and 98 machines.
- Debug will slow performance.
- Debug should not be run in Production.
- Use a user id that is not being shared (use your own id, not VP1).
- Some clients have seen connection problems for other users after the debug has been performed. If this happens, perform debugging in the evening or during times that few users are in the database. If the connection problem occurs, then reboot the Application and Web Servers. Since the debug should not be run in Production, this minor occurrence can be handled by rebooting the proper servers/services.